
Conveyor Sorting
OpenPLC and Ignition: ladder logic, a Structured Text state machine, sensor feedback, and verifiable normal cycles.

This educational case shows how a MES layer can sit alongside a PLC. The controller remains the source of facts: cell state, faults and counters. MES adds time and order context, while the Dashboard brings the result together.
I followed one scenario from operator actions to events and calculation. That makes it possible not only to see OEE, but to understand where each duration came from and which cause affected Availability.
The screens show different parts of the scenario: state transitions, OEE validation and the final Pareto. The shared history makes it possible to trace each metric back to an event and calculation rule.



The HMI helps an operator work with the cell. MES solves a different task: it retains what happened to one order, how long it took and how it affected the final result.

The PLC holds cell state, fault code, run permission and production counters. The HMI shows these facts instead of replacing them with local UI state.
A Gateway Timer reads PLC facts and records the order baseline, status and events. It does not command the PLC or calculate KPIs.
Named Queries bring together the order history. The Dashboard shows the calculated result, but cannot create production data or change cell logic.
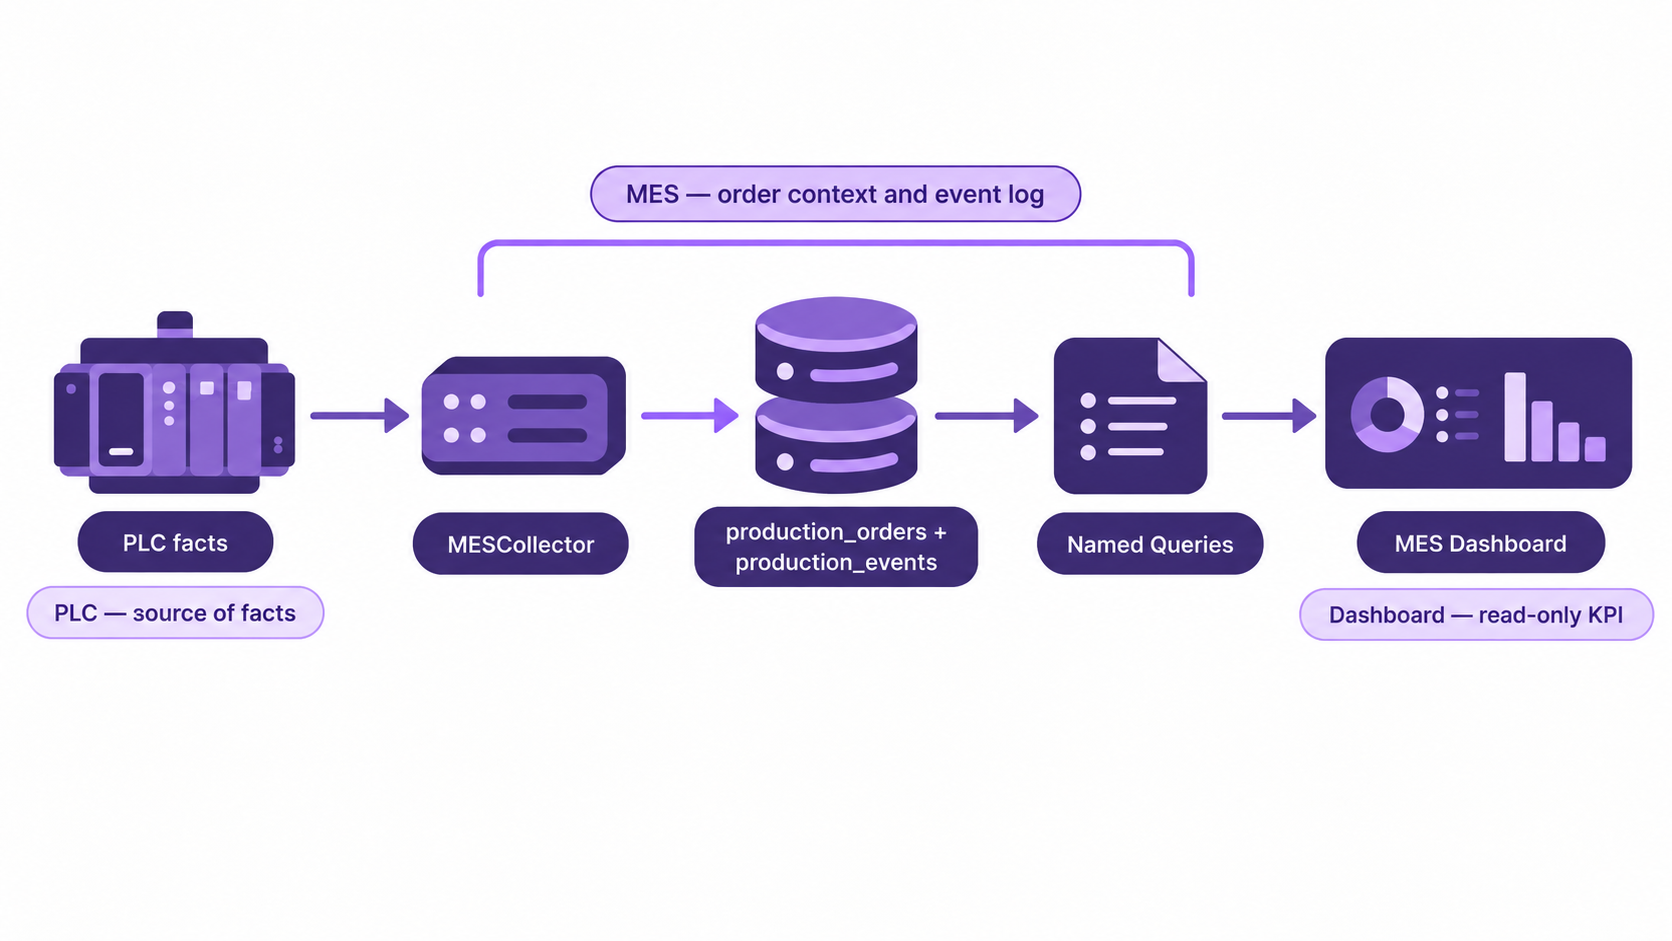
At the start, an order gets a target, counter baseline, start time and status. While it is active, MESCollector associates PLC facts with its order_id. At ORDER COMPLETE the report boundary is fixed, so an open Dashboard cannot change durations.

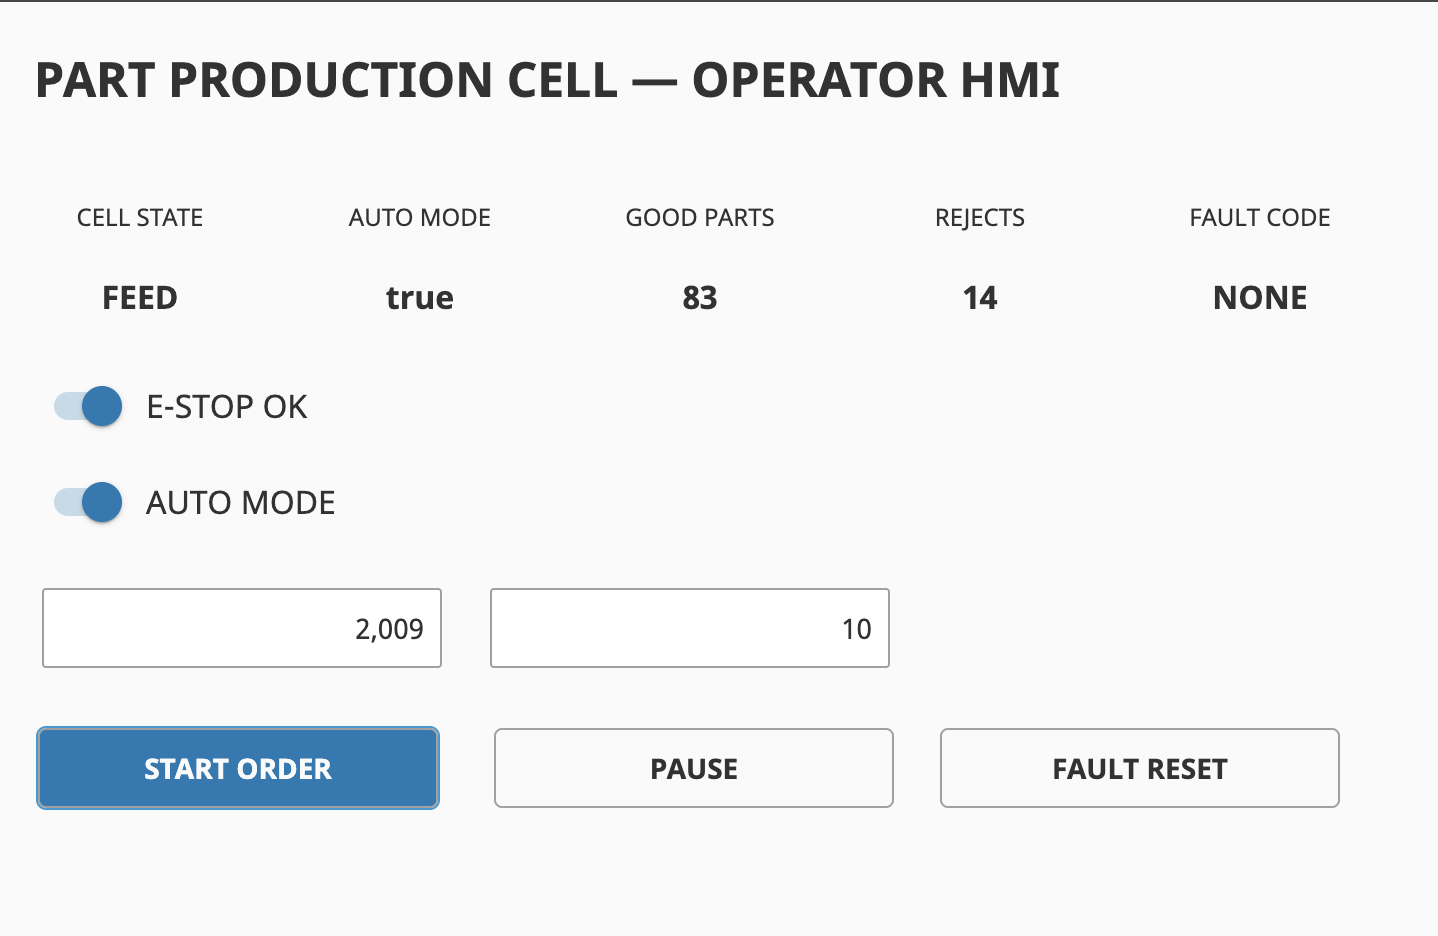
In #2009, the cell accepts material. MES associates this normal state with the active order_id.
The cell enters FAULT when E-STOP OK is broken. MES retains fault code 60 with the active order_id.
E-STOP is retained as the FAULT cause. After reset, MES adds FAULT_CLEARED and STATE_PAUSED, so recovery remains in the order history.
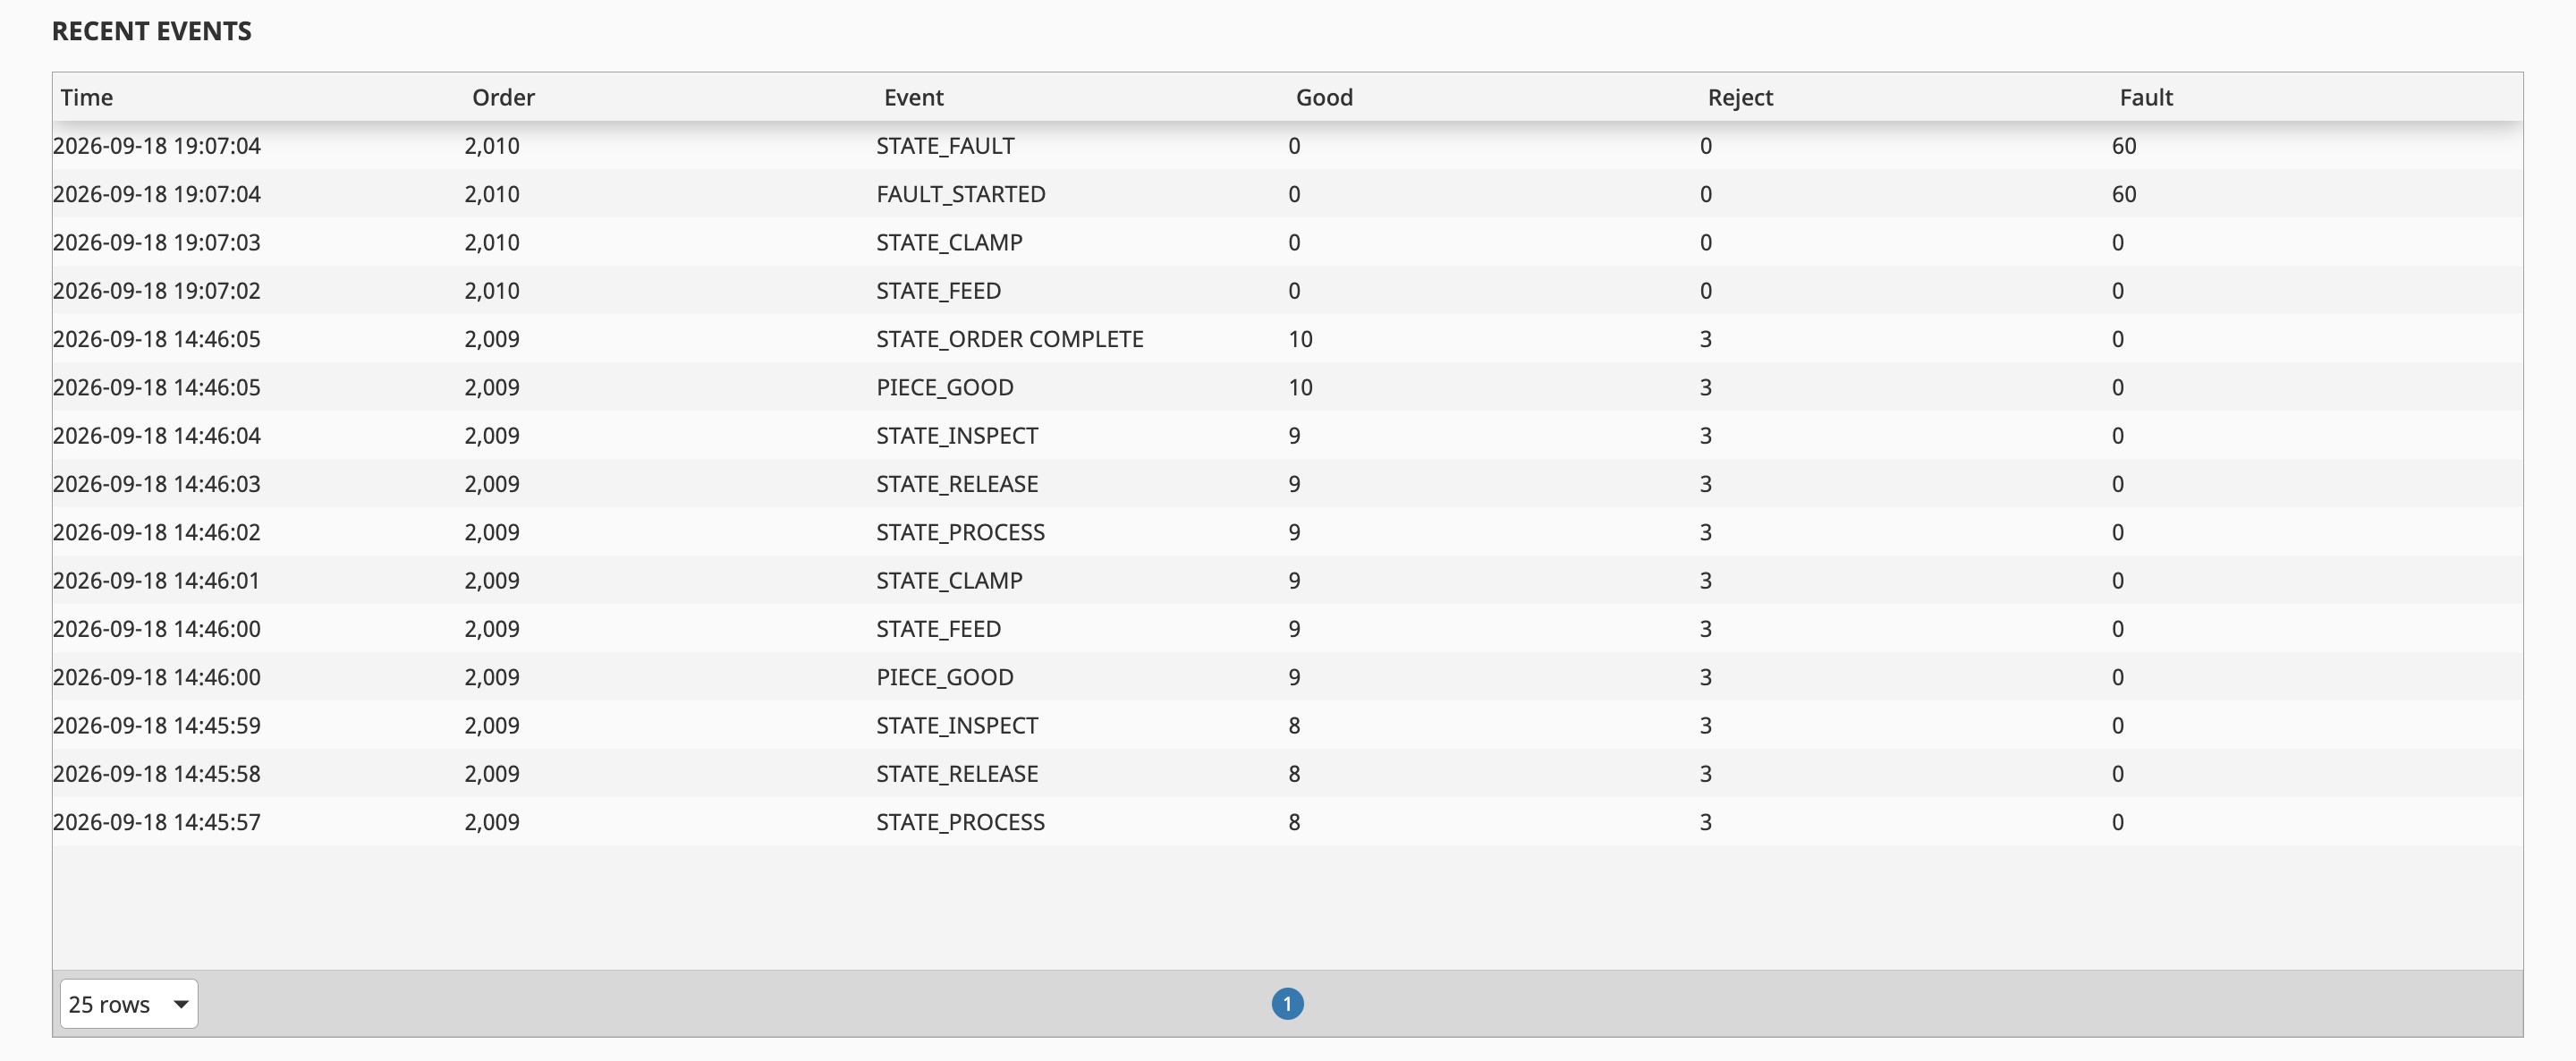
production_events stores time, order_id, state, fault context and event type. Instead of another screen snapshot, the journal keeps the transition itself: a good or rejected part, material starvation, a fault, fault recovery and state changes.

PIECE_GOOD and PIECE_REJECT retain each part result. Good, Reject and Total are calculated from the order baseline, not from the machine-wide counter.
STATE_* builds the sequence: feed, clamp, process, inspect, release, pause and fault. This sequence supports duration calculation.
FAULT_STARTED and FAULT_CLEARED retain the fault code with the active order_id. The Dashboard shows both the current error and its place in order history.
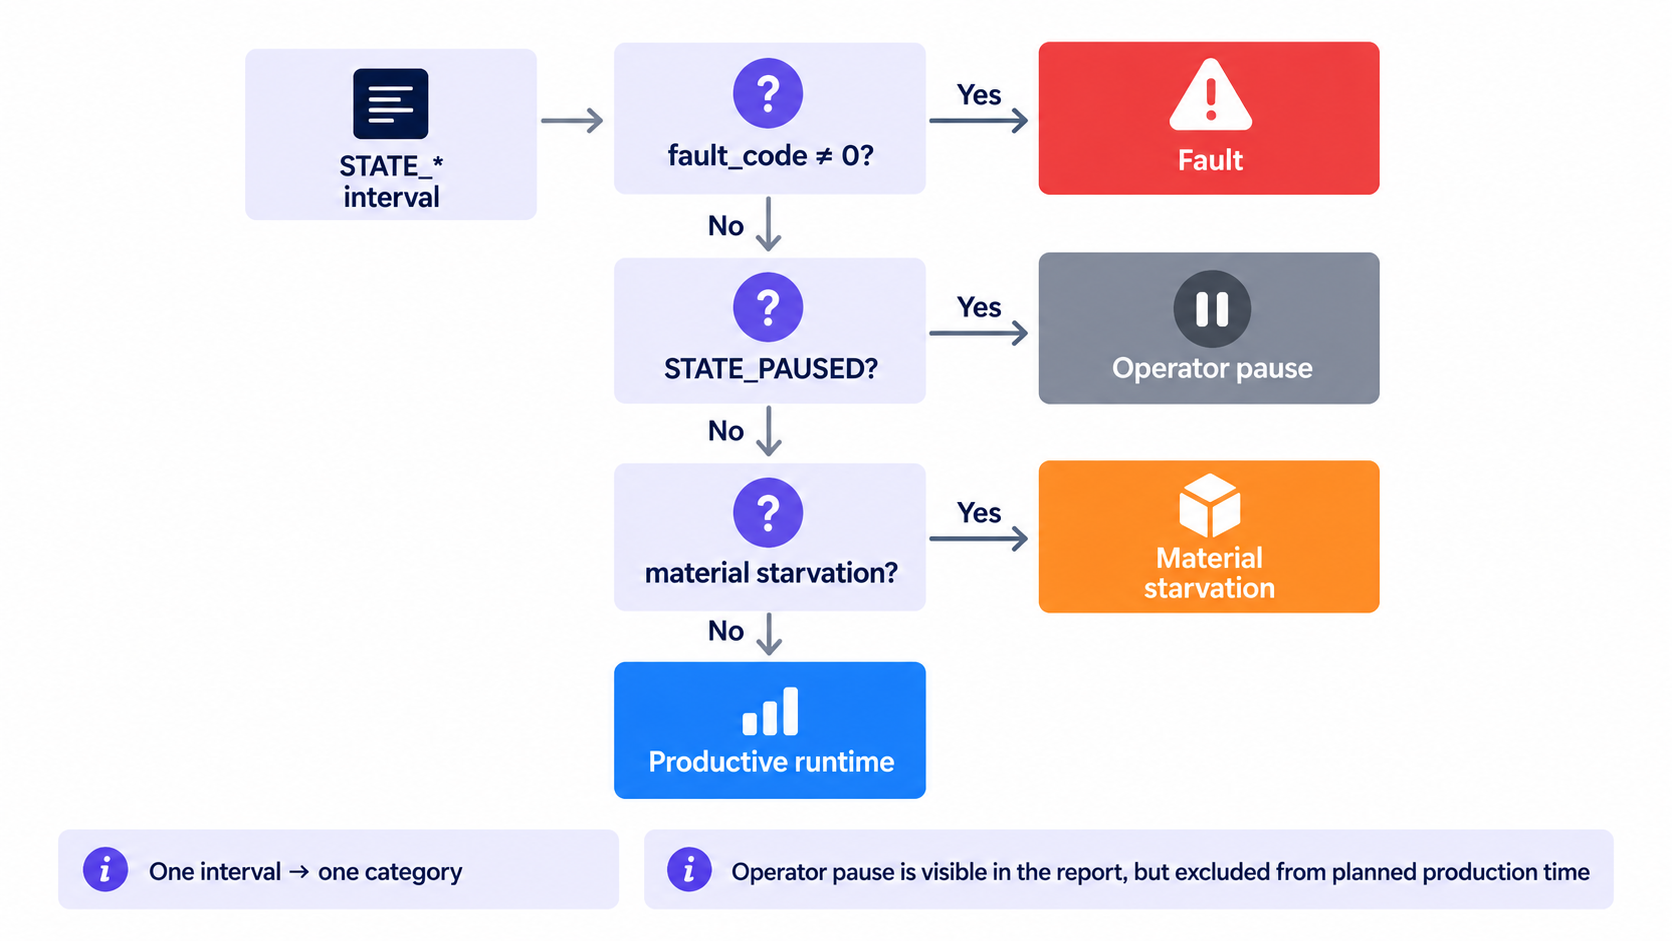
SQL builds duration between neighbouring events. Simultaneous piece and state events stay as markers rather than creating an extra interval. The report then shows a clear balance of total time, pause, fault, material wait and runtime.

An interval is checked for a fault first, then an operator pause, then material starvation. This keeps the same time from being counted twice.
Operator PAUSED is a planned working pause. It remains in the breakdown, but is not part of planned production time and does not reduce Availability.
For #2010, unclassified_ms = 0. All observed time is assigned to clear categories instead of disappearing between polls.
Performance needs an ideal cycle, and OEE needs all three valid components. If data is missing, the Dashboard honestly shows N/A. Pareto then retains only the causes that actually reduced Availability.

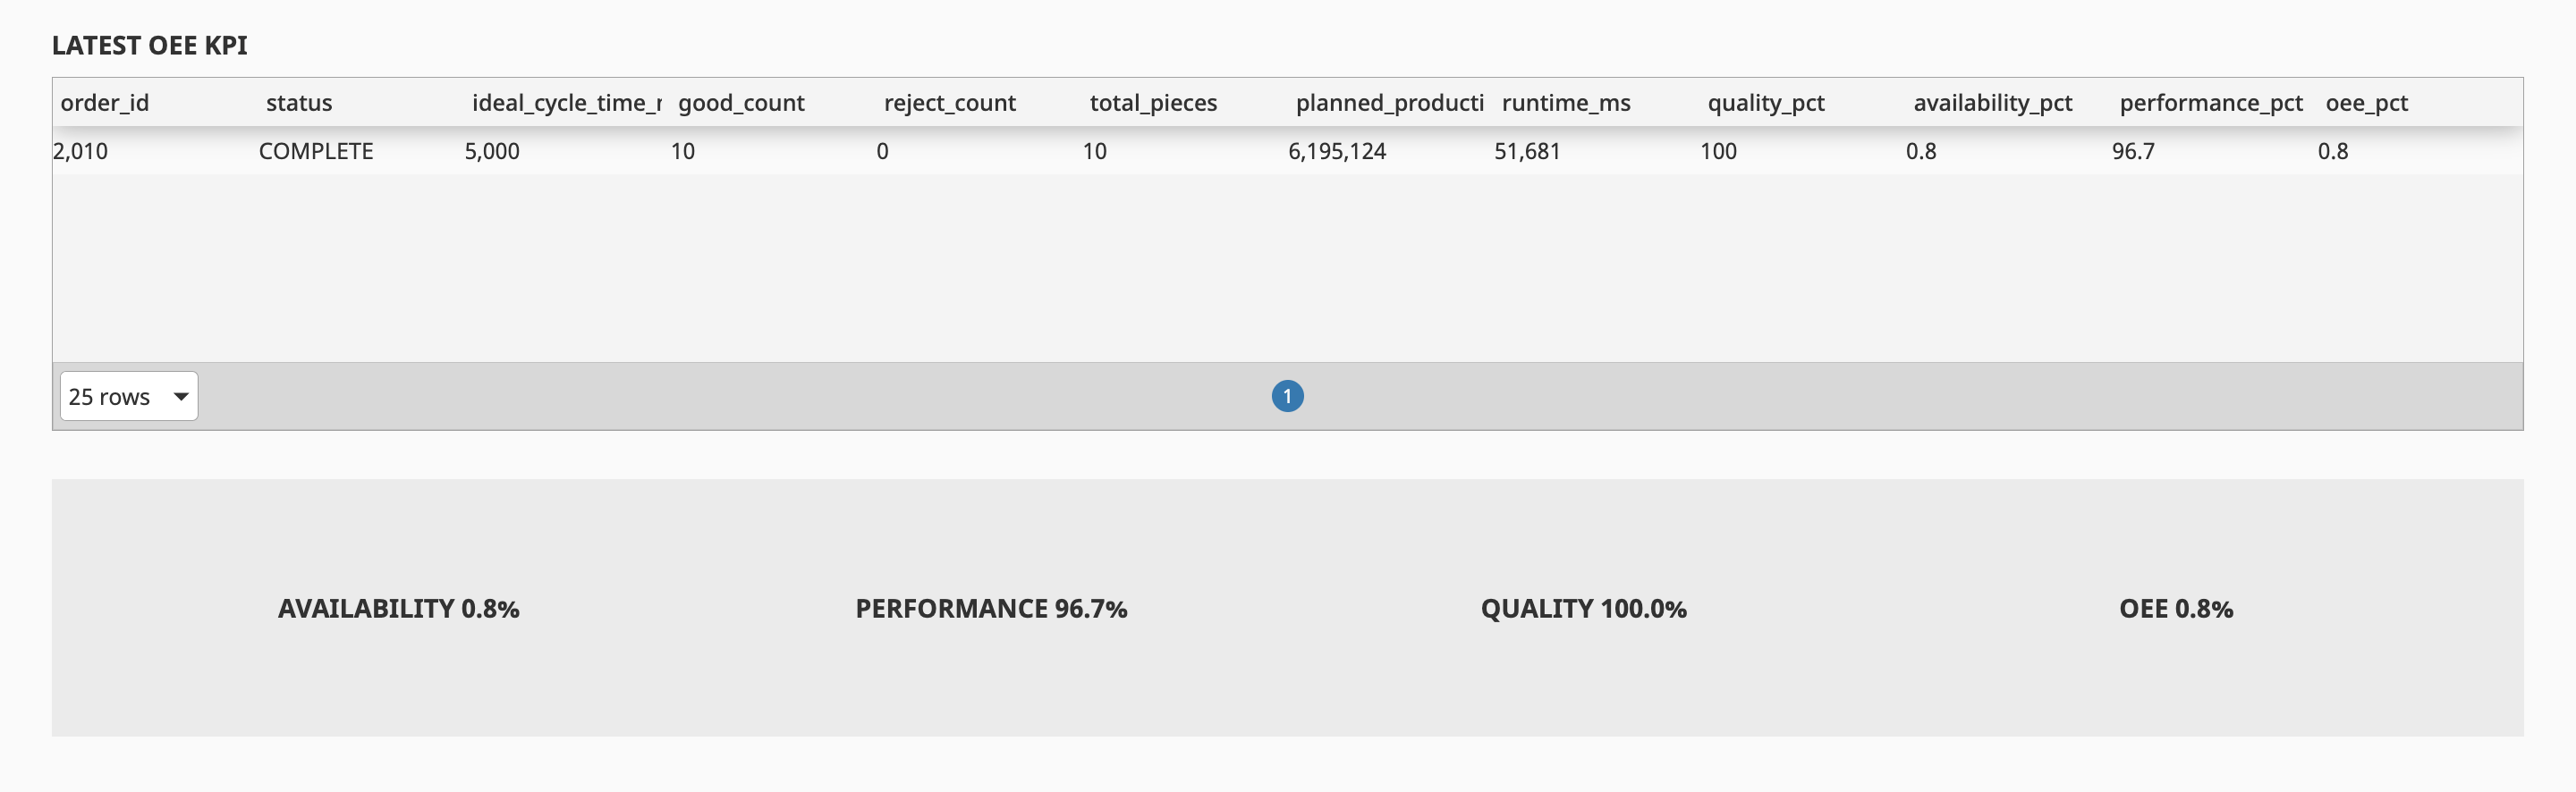
For completed #2010, the calculation receives ideal_cycle_time_ms = 5,000. It is used only for Performance: the screen shows 96.7% Performance and 100% Quality. It does not affect PLC motion.
With ideal_cycle_time_ms = 0, Performance is not shown as a percentage and OEE becomes N/A. Availability and Quality remain visible. Restoring 5,000 ms restores the calculation.
Final KPIs: Availability 54.3%, Performance 80.5%, Quality 76.9% and OEE 33.6%. Pareto shows why Availability fell: E-stop took the most time, followed by material starvation.
What the case shows:
OpenPLC and Ignition: ladder logic, a Structured Text state machine, sensor feedback, and verifiable normal cycles.

OpenPLC, Modbus TCP, and Ignition: from ladder logic to a verifiable operator scenario.

Enterprise monitoring for a nuclear plant: system states, engineering constraints, and 3D storage logic.